
Page 71 - Bank-Muamalat-Annual-Report-2021
P. 71
ANNUAL REPORT 2021 69
SUSTAINABILITY STATEMENT OUR GOVERNANCE OUR NUMBERS OTHER INFORMATION
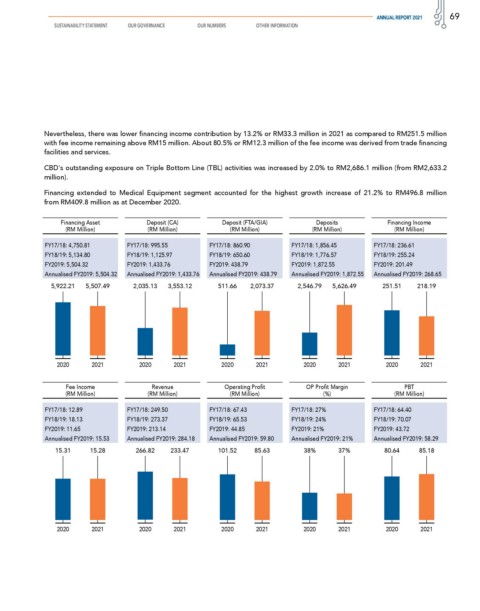
Nevertheless, there was lower financing income contribution by 13.2% or RM33.3 million in 2021 as compared to RM251.5 million
with fee income remaining above RM15 million. About 80.5% or RM12.3 million of the fee income was derived from trade financing
facilities and services.
CBD's outstanding exposure on Triple Bottom Line (TBL) activities was increased by 2.0% to RM2,686.1 million (from RM2,633.2
million).
Financing extended to Medical Equipment segment accounted for the highest growth increase of 21.2% to RM496.8 million
from RM409.8 million as at December 2020.
Financing Asset Deposit (CA) Deposit (FTA/GIA) Deposits Financing Income
(RM Million) (RM Million) (RM Million) (RM Million) (RM Million)
FY17/18: 4,750.81 FY17/18: 995.55 FY17/18: 860.90 FY17/18: 1,856.45 FY17/18: 236.61
FY18/19: 5,134.80 FY18/19: 1,125.97 FY18/19: 650.60 FY18/19: 1,776.57 FY18/19: 255.24
FY2019: 5,504.32 FY2019: 1,433.76 FY2019: 438.79 FY2019: 1,872.55 FY2019: 201.49
Annualised FY2019: 5,504.32 Annualised FY2019: 1,433.76 Annualised FY2019: 438.79 Annualised FY2019: 1,872.55 Annualised FY2019: 268.65
5,922.21 5,507.49 2,035.13 3,553.12 511.66 2,073.37 2,546.79 5,626.49 251.51 218.19
2020 2021 2020 2021 2020 2021 2020 2021 2020 2021
Fee Income Revenue Operating Profit OP Profit Margin PBT
(RM Million) (RM Million) (RM Million) (%) (RM Million)
FY17/18: 12.89 FY17/18: 249.50 FY17/18: 67.43 FY17/18: 27% FY17/18: 64.40
FY18/19: 18.13 FY18/19: 273.37 FY18/19: 65.53 FY18/19: 24% FY18/19: 70.07
FY2019: 11.65 FY2019: 213.14 FY2019: 44.85 FY2019: 21% FY2019: 43.72
Annualised FY2019: 15.53 Annualised FY2019: 284.18 Annualised FY2019: 59.80 Annualised FY2019: 21% Annualised FY2019: 58.29
15.31 15.28 266.82 233.47 101.52 85.63 38% 37% 80.64 85.18
2020 2021 2020 2021 2020 2021 2020 2021 2020 2021