
Page 69 - Bank-Muamalat-AR2020
P. 69
67
Governance
Our Performance Sustainability Statement Our Governance Our Numbers Other Information
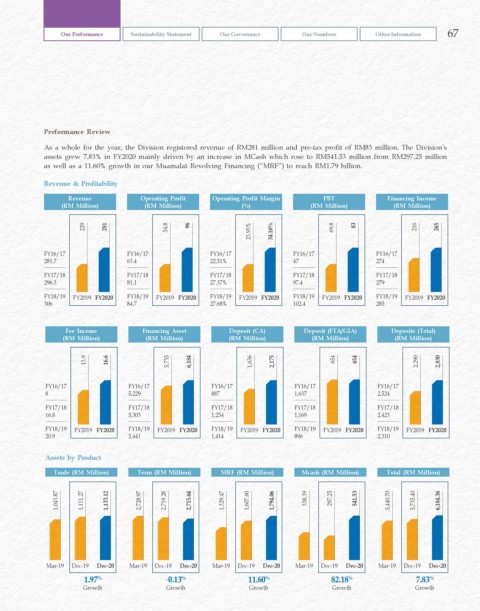
Performance Review
As a whole for the year, the Division registered revenue of RM281 million and pre-tax profit of RM83 million. The Division’s
assets grew 7.83% in FY2020 mainly driven by an increase in MCash which rose to RM541.53 million from RM297.25 million
as well as a 11.60% growth in our Muamalat Revolving Financing (“MRF”) to reach RM1.79 billion.
Revenue & Profitability
Revenue Operating Profit Operating Profit Margin PBT Financing Income
(RM Million) (RM Million) (%) (RM Million) (RM Million)
229 281 54.8 96 23.93% 34.16% 69.8 83 216 265
FY16/17 FY16/17 FY16/17 FY16/17 FY16/17
281.7 63.4 22.51% 47 274
FY17/18 FY17/18 FY17/18 FY17/18 FY17/18
296.3 81.1 27.37% 97.4 279
FY18/19 FY2019 FY2020 FY18/19 FY2019 FY2020 FY18/19 FY2019 FY2020 FY18/19 FY2019 FY2020 FY18/19 FY2019 FY2020
306 84.7 27.68% 102.4 285
Fee Income Financing Asset Deposit (CA) Deposit (FTA/GIA) Deposits (Total)
(RM Million) (RM Million) (RM Million) (RM Million) (RM Million)
13.9 16.6 5,735 6,184 1,636 2,175 654 654 2,290 2,830
FY16/17 FY16/17 FY16/17 FY16/17 FY16/17
8 5,229 887 1,637 2,524
FY17/18 FY17/18 FY17/18 FY17/18 FY17/18
16.8 5,303 1,254 1,169 2,423
FY18/19 FY2019 FY2020 FY18/19 FY2019 FY2020 FY18/19 FY2019 FY2020 FY18/19 FY2019 FY2020 FY18/19 FY2019 FY2020
20.9 5,441 1,414 896 2,310
Assets by Product
Trade (RM Million) Term (RM Million) MRF (RM Million) Mcash (RM Million) Total (RM Million)
1,043.87 1,111.27 1,133.12 2,728.97 2,719.28 2,715.64 1,329.47 1,607.60 1,794.06 338.39 297.25 541.53 5,440.70 5,735.40 6,184.36
Mar-19 Dec-19 Dec-20 Mar-19 Dec-19 Dec-20 Mar-19 Dec-19 Dec-20 Mar-19 Dec-19 Dec-20 Mar-19 Dec-19 Dec-20
1.97 % - 0.13 % 11.60 % 82.18 % 7.83 %
Growth Growth Growth Growth Growth