
Page 372 - Bank-Muamalat-AR2020
P. 372
370 BANK MUAMALAT MALAYSIA BERHAD About Us Our Leadership Our Strategy
ANNUAL REPORT FY2020
BASEL II
PILLAr 3 DISCLOSurE
4.0 CrEDIT rISk (GENErAL DISCLOSurE) (CONT’D)
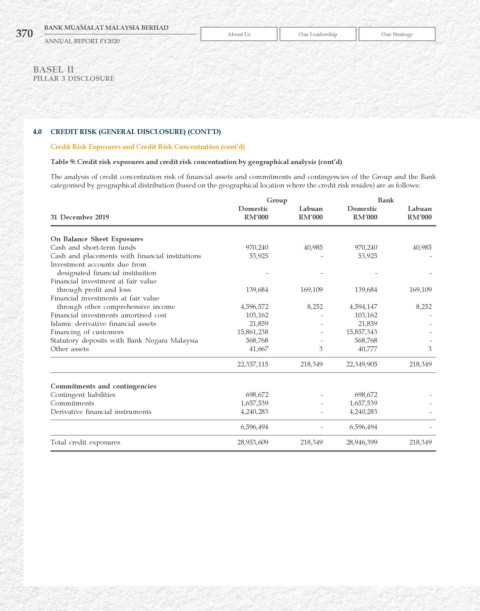
Credit risk Exposures and Credit risk Concentration (cont’d)
Table 9: Credit risk exposures and credit risk concentration by geographical analysis (cont’d)
The analysis of credit concentration risk of financial assets and commitments and contingencies of the Group and the Bank
categorised by geographical distribution (based on the geographical location where the credit risk resides) are as follows:
Group Bank
Domestic Labuan Domestic Labuan
31 December 2019 rM’000 rM’000 rM’000 rM’000
On Balance Sheet Exposures
Cash and short-term funds 970,240 40,985 970,240 40,985
Cash and placements with financial institutions 53,925 - 53,925 -
Investment accounts due from
designated financial instituition - - - -
Financial investment at fair value
through profit and loss 139,684 169,109 139,684 169,109
Financial investments at fair value
through other comprehensive income 4,596,572 8,252 4,594,147 8,252
Financial investments amortised cost 103,162 - 103,162 -
Islamic derivative financial assets 21,859 - 21,859 -
Financing of customers 15,861,238 - 15,857,343 -
Statutory deposits with Bank Negara Malaysia 568,768 - 568,768 -
Other assets 41,667 3 40,777 3
22,357,115 218,349 22,349,905 218,349
Commitments and contingencies
Contingent liabilities 698,672 - 698,672 -
Commitments 1,657,539 - 1,657,539 -
Derivative financial instruments 4,240,283 - 4,240,283 -
6,596,494 - 6,596,494 -
Total credit exposures 28,953,609 218,349 28,946,399 218,349