
Page 298 - Bank-Muamalat-Annual-Report-2021
P. 298
296 bank MuaMalat Malaysia berhaD
ABOUT US OUR LEADERSHIP OUR STRATEGY OUR PERFORMANCE
NOTES TO THE FINANCIAL STATEMENTS
31 DECEMbEr 2021 (26 JAMADIL AwAL 1443H)
46. fINANcIAL RIsk MANAGeMeNT OBJecTIves AND POLIcIes (cONT’D.)
(a) credit risk (cont’d.)
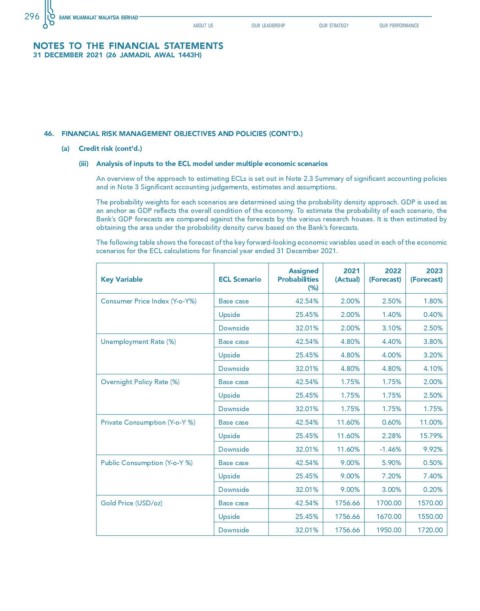
(iii) Analysis of inputs to the ecL model under multiple economic scenarios
An overview of the approach to estimating ECLs is set out in Note 2.3 Summary of significant accounting policies
and in Note 3 Significant accounting judgements, estimates and assumptions.
The probability weights for each scenarios are determined using the probability density approach. GDP is used as
an anchor as GDP reflects the overall condition of the economy. To estimate the probability of each scenario, the
Bank’s GDP forecasts are compared against the forecasts by the various research houses. It is then estimated by
obtaining the area under the probability density curve based on the Bank’s forecasts.
The following table shows the forecast of the key forward-looking economic variables used in each of the economic
scenarios for the ECL calculations for financial year ended 31 December 2021.
Assigned 2021 2022 2023
key variable ecL scenario Probabilities (Actual) (forecast) (forecast)
(%)
Consumer Price Index (Y-o-Y%) Base case 42.54% 2.00% 2.50% 1.80%
Upside 25.45% 2.00% 1.40% 0.40%
Downside 32.01% 2.00% 3.10% 2.50%
Unemployment Rate (%) Base case 42.54% 4.80% 4.40% 3.80%
Upside 25.45% 4.80% 4.00% 3.20%
Downside 32.01% 4.80% 4.80% 4.10%
Overnight Policy Rate (%) Base case 42.54% 1.75% 1.75% 2.00%
Upside 25.45% 1.75% 1.75% 2.50%
Downside 32.01% 1.75% 1.75% 1.75%
Private Consumption (Y-o-Y %) Base case 42.54% 11.60% 0.60% 11.00%
Upside 25.45% 11.60% 2.28% 15.79%
Downside 32.01% 11.60% -1.46% 9.92%
Public Consumption (Y-o-Y %) Base case 42.54% 9.00% 5.90% 0.50%
Upside 25.45% 9.00% 7.20% 7.40%
Downside 32.01% 9.00% 3.00% 0.20%
Gold Price (USD/oz) Base case 42.54% 1756.66 1700.00 1570.00
Upside 25.45% 1756.66 1670.00 1550.00
Downside 32.01% 1756.66 1950.00 1720.00