Page 264 - Bank-Muamalat-AR2020
P. 264

262    BANK MUAMALAT MALAYSIA BERHAD                   About Us           Our Leadership       Our Strategy
            ANNUAL REPORT FY2020


          Notes to the fiNaNcial statemeNts
          31 December 2020 (16 JamaDil awal 1442h)


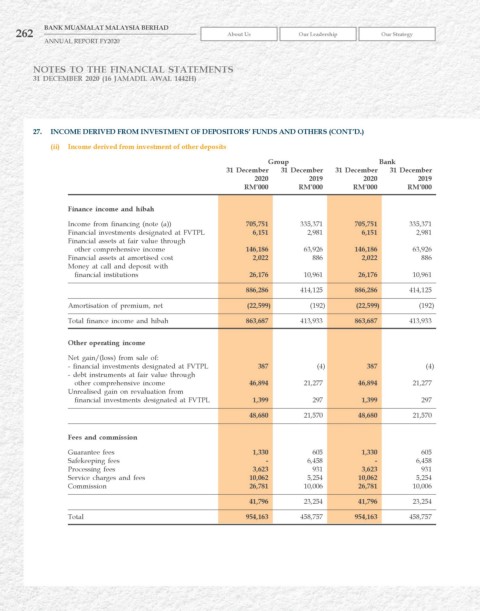
          27.   INCOME DErIvED FrOM INvESTMENT OF DEPOSITOrS’ FuNDS AND OThErS (CONT’D.)
              (ii)  Income derived from investment of other deposits

                                                                       Group                        Bank
                                                            31 December    31 December    31 December    31 December
                                                                   2020           2019          2020          2019
                                                                  rM’000        rM’000        rM’000        rM’000

                   Finance income and hibah

                   Income from financing (note (a))              705,751       335,371        705,751       335,371
                   Financial investments designated at FVTPL       6,151         2,981         6,151         2,981
                   Financial assets at fair value through
                    other comprehensive income                    146,186       63,926        146,186        63,926
                   Financial assets at amortised cost              2,022          886          2,022           886
                   Money at call and deposit with
                    financial institutions                        26,176        10,961        26,176         10,961
                                                                 886,286       414,125        886,286       414,125

                   Amortisation of premium, net                  (22,599)         (192)       (22,599)        (192)
                   Total finance income and hibah                863,687       413,933        863,687       413,933


                   Other operating income
                   Net gain/(loss) from sale of:
                   - financial investments designated at FVTPL      387             (4)          387            (4)
                   - debt instruments at fair value through
                    other comprehensive income                    46,894        21,277        46,894         21,277
                   Unrealised gain on revaluation from
                    financial investments designated at FVTPL       1,399         297           1,399          297

                                                                  48,680        21,570        48,680         21,570

                   Fees and commission

                   Guarantee fees                                  1,330          605          1,330           605
                   Safekeeping fees                                   -          6,458             -         6,458
                   Processing fees                                 3,623          931          3,623           931
                   Service charges and fees                       10,062         5,254        10,062         5,254
                   Commission                                     26,781        10,006        26,781         10,006

                                                                  41,796        23,254        41,796         23,254
                   Total                                         954,163       458,757        954,163       458,757
   259   260   261   262   263   264   265   266   267   268   269