Page 104 - Bank-Muamalat-Annual-Report-2021
P. 104

102      BANK MUAMALAT MALAYSIA BERHAD
                                                   ABOUT US       OUR LEADERSHIP    OUR STRATEGY    OUR PERFORMANCE

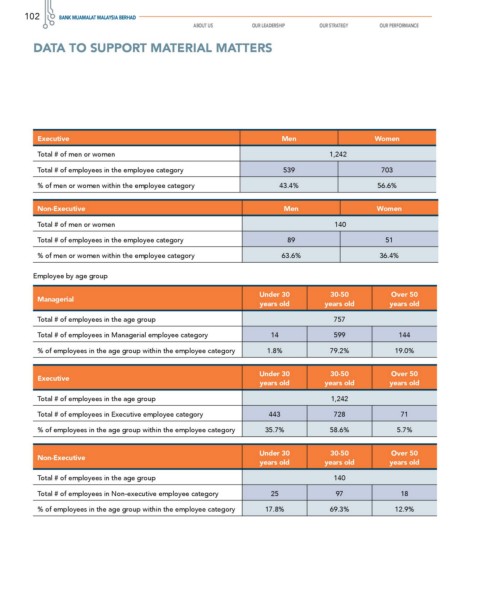
          DATA TO SUPPORT MATERIAL MATTERS


           Executive                                                      Men                     Women

           Total # of men or women                                                     1,242
           Total # of employees in the employee category                   539                      703

           % of men or women within the employee category                 43.4%                    56.6%

           Non-Executive                                                   Men                     Women

           Total # of men or women                                                      140
           Total # of employees in the employee category                    89                       51

           % of men or women within the employee category                 63.6%                     36.4%

          Employee by age group

                                                                    Under 30           30-50           Over 50
           Managerial
                                                                    years old        years old        years old
           Total # of employees in the age group                                        757

           Total # of employees in Managerial employee category        14               599              144
           % of employees in the age group within the employee category  1.8%          79.2%            19.0%


                                                                    Under 30           30-50           Over 50
           Executive
                                                                    years old        years old        years old
           Total # of employees in the age group                                       1,242

           Total # of employees in Executive employee category         443              728              71
           % of employees in the age group within the employee category  35.7%         58.6%            5.7%


                                                                    Under 30           30-50           Over 50
           Non-Executive
                                                                    years old        years old        years old
           Total # of employees in the age group                                        140

           Total # of employees in Non-executive employee category     25               97               18
           % of employees in the age group within the employee category  17.8%         69.3%            12.9%
   99   100   101   102   103   104   105   106   107   108   109