Page 373 - Bank-Muamalat_Annual-Report-2023
P. 373

ANNUAL REPORT 2023
                                                                                                        OUR NUMBERS


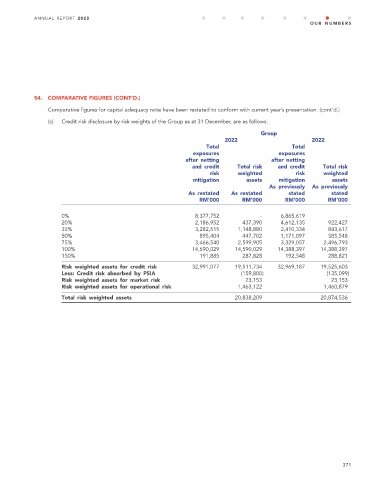
            54.  COMPARATIVE FIGURES (CONT’D.)
                 Comparative figures for capital adequacy note have been restated to conform with current year’s presentation. (cont’d.)

                 (c)   Credit risk disclosure by risk weights of the Group as at 31 December, are as follows:
                                                                                       Group
                                                                           2022                         2022
                                                                     Total                        Total
                                                                  exposures                   exposures
                                                                after  netting              after  netting
                                                                  and  credit       Total  risk       and  credit       Total  risk
                                                                        risk       weighted         risk       weighted
                                                                  mitigation        assets       mitigation       assets
                                                                                           As  previously   As  previously
                                                               As  restated   As  restated      stated         stated
                                                                   RM’000        RM’000        RM’000         RM’000

                     0%                                           8,377,752            -       6,865,619             -
                     20%                                          2,186,952      437,390       4,612,135      922,427
                     35%                                           3,282,515     1,148,880     2,410,334      843,617
                     50%                                           895,404        447,702      1,171,097      585,548
                     75%                                          3,466,540      2,599,905     3,329,057     2,496,793
                     100%                                        14,590,029     14,590,029     14,388,397     14,388,397
                     150%                                          191,885       287,828       192,548        288,821

                     Risk  weighted  assets  for  credit  risk   32,991,077     19,511,734     32,969,187     19,525,603
                     Less:  Credit  risk  absorbed  by  PSIA                     (159,800)                   (135,099)
                     Risk  weighted  assets  for  market  risk                    23,153                       23,153
                     Risk  weighted  assets  for  operational  risk             1,463,122                   1,460,879
                     Total  risk  weighted  assets                             20,838,209                  20,874,536


                                                                                                                  371
   368   369   370   371   372   373   374   375   376   377   378