
Page 118 - Bank-Muamalat_Annual-Report-2023
P. 118
BANK MUAMALAT MALAYSIA BERHAD
DATA ON
MATERIAL MATTERS
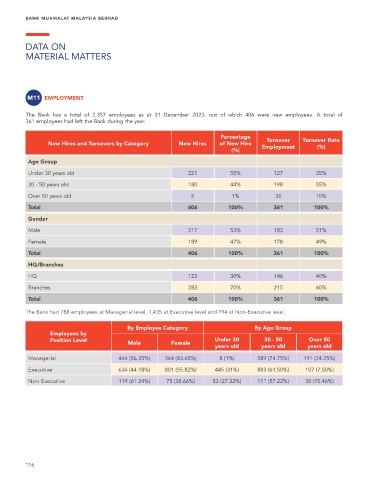
M11 EMPLOYMENT
The Bank has a total of 2,357 employees as at 31 December 2023, out of which 406 were new employees. A total of
361 employees had left the Bank during the year.
Percentage
Turnover Turnover Rate
New Hires and Turnovers by Category New Hires of New Hire
Employment (%)
(%)
Age Group
Under 30 years old 221 55% 127 35%
30 - 50 years old 180 44% 198 55%
Over 50 years old 5 1% 36 10%
Total 406 100% 361 100%
Gender
Male 217 53% 183 51%
Female 189 47% 178 49%
Total 406 100% 361 100%
HQ/Branches
HQ 123 30% 146 40%
Branches 283 70% 215 60%
Total 406 100% 361 100%
The Bank had 788 employees at Managerial level, 1,435 at Executive level and 194 at Non-Executive level.
By Employee Category By Age Group
Employees by
Position Level Under 30 30 - 50 Over 50
Male Female
years old years old years old
Managerial 444 (56.35%) 344 (43.65%) 8 (1%) 589 (74.75%) 191 (24.25%)
Executive 634 (44.18%) 801 (55.82%) 445 (31%) 883 (61.50%) 107 (7.50%)
Non-Executive 119 (61.34%) 75 (38.66%) 53 (27.32%) 111 (57.22%) 30 (15.46%)
116