Page 297 - Bank-Muamalat-AR2020
P. 297

295
                 Our Performance   Sustainability Statement  Governance        Our Numbers         Other Information


            46.   FINANCIAL rISk MANAGEMENT OBJECTIvES AND POLICIES (CONT’D.)
                 (a)   Credit risk (cont’d.)

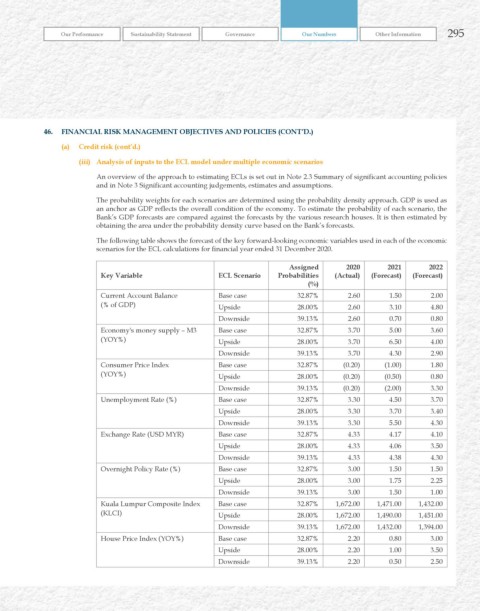
                     (iii)  Analysis of inputs to the ECL model under multiple economic scenarios
                          An overview of the approach to estimating ECLs is set out in Note 2.3 Summary of significant accounting policies
                          and in Note 3 Significant accounting judgements, estimates and assumptions.

                          The probability weights for each scenarios are determined using the probability density approach. GDP is used as
                          an anchor as GDP reflects the overall condition of the economy. To estimate the probability of each scenario, the
                          Bank’s GDP forecasts are compared against the forecasts by the various research houses. It is then estimated by
                          obtaining the area under the probability density curve based on the Bank’s forecasts.
                          The following table shows the forecast of the key forward-looking economic variables used in each of the economic
                          scenarios for the ECL calculations for financial year ended 31 December 2020.

                                                                            Assigned       2020       2021       2022
                           key variable                   ECL Scenario   Probabilities   (Actual)  (Forecast)  (Forecast)
                                                                                 (%)
                           Current Account Balance        Base case           32.87%        2.60       1.50       2.00
                           (% of GDP)                     Upside              28.00%        2.60       3.10       4.80
                                                          Downside            39.13%        2.60       0.70       0.80
                           Economy's money supply – M3    Base case           32.87%        3.70       5.00       3.60
                           (YOY%)                         Upside              28.00%        3.70       6.50       4.00

                                                          Downside            39.13%        3.70       4.30       2.90
                           Consumer Price Index           Base case           32.87%       (0.20)     (1.00)      1.80
                           (YOY%)                         Upside              28.00%       (0.20)     (0.50)      0.80
                                                          Downside            39.13%       (0.20)     (2.00)      3.30
                           Unemployment Rate (%)          Base case           32.87%        3.30       4.50       3.70
                                                          Upside              28.00%        3.30       3.70       3.40
                                                          Downside            39.13%        3.30       5.50       4.30
                           Exchange Rate (USD MYR)        Base case           32.87%        4.33       4.17       4.10
                                                          Upside              28.00%        4.33       4.06       3.50
                                                          Downside            39.13%        4.33       4.38       4.30
                           Overnight Policy Rate (%)      Base case           32.87%        3.00       1.50       1.50
                                                          Upside              28.00%        3.00       1.75       2.25
                                                          Downside            39.13%        3.00       1.50       1.00
                           Kuala Lumpur Composite Index   Base case           32.87%     1,672.00    1,471.00    1,432.00
                           (KLCI)                         Upside              28.00%     1,672.00    1,490.00    1,451.00
                                                          Downside            39.13%     1,672.00    1,432.00    1,394.00
                           House Price Index (YOY%)       Base case           32.87%        2.20       0.80      3.00
                                                          Upside              28.00%        2.20       1.00      3.50
                                                          Downside            39.13%        2.20       0.50      2.50
   292   293   294   295   296   297   298   299   300   301   302