
Page 13 - Bank-Muamalat_Annual-Report-2023
P. 13
ANNUAL REPORT 2023
OVERVIEW
5 YEARS FINANCIAL
HIGHLIGHTS
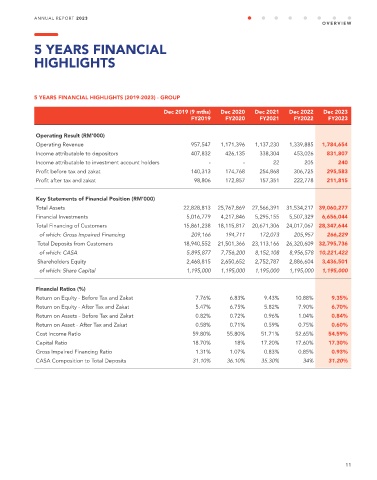
5 YEARS FINANCIAL HIGHLIGHTS (2019-2023) - GROUP
Dec 2019 (9 mths) Dec 2020 Dec 2021 Dec 2022 Dec 2023
FY2019 FY2020 FY2021 FY2022 FY2023
Operating Result (RM’000)
Operating Revenue 957,547 1,171,396 1,137,230 1,339,885 1,784,654
Income attributable to depositors 407,832 426,135 338,304 453,026 831,807
Income attributable to investment account holders - - 22 205 240
Profit before tax and zakat 140,313 174,768 254,868 306,725 295,583
Profit after tax and zakat 98,806 172,857 157,351 222,778 211,815
Key Statements of Financial Position (RM’000)
Total Assets 22,828,813 25,767,869 27,566,391 31,534,217 39,060,277
Financial Investments 5,016,779 4,217,846 5,295,155 5,507,329 6,656,044
Total Financing of Customers 15,861,238 18,115,817 20,671,306 24,017,067 28,347,644
of which: Gross Impaired Financing 209,166 194,711 172,073 205,957 266,229
Total Deposits from Customers 18,940,552 21,501,366 23,113,166 26,320,609 32,795,736
of which: CASA 5,895,877 7,756,200 8,152,108 8,956,578 10,221,422
Shareholders Equity 2,468,815 2,650,652 2,752,787 2,886,604 3,436,501
of which: Share Capital 1,195,000 1,195,000 1,195,000 1,195,000 1,195,000
Financial Ratios (%)
Return on Equity - Before Tax and Zakat 7.76% 6.83% 9.43% 10.88% 9.35%
Return on Equity - After Tax and Zakat 5.47% 6.75% 5.82% 7.90% 6.70%
Return on Assets - Before Tax and Zakat 0.82% 0.72% 0.96% 1.04% 0.84%
Return on Asset - After Tax and Zakat 0.58% 0.71% 0.59% 0.75% 0.60%
Cost Income Ratio 59.80% 55.80% 51.71% 52.65% 54.59%
Capital Ratio 18.70% 18% 17.20% 17.60% 17.30%
Gross Impaired Financing Ratio 1.31% 1.07% 0.83% 0.85% 0.93%
CASA Composition to Total Deposits 31.10% 36.10% 35.30% 34% 31.20%
11