
Page 11 - Bank-Muamalat-AR2020
P. 11
9
Our Performance Sustainability Statement Our Governance Our Numbers Other Information
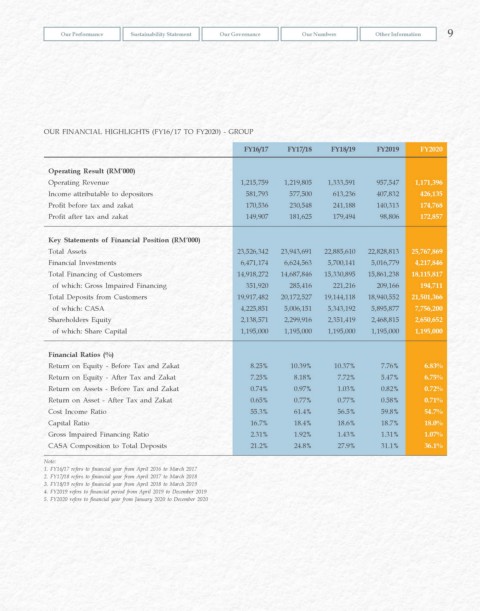
OUR FINANCIAL HIGHLIGHTS (FY16/17 TO FY2020) - GROUP
FY16/17 FY17/18 FY18/19 FY2019 FY2020
Operating Result (RM’000)
Operating Revenue 1,215,759 1,219,805 1,333,591 957,547 1,171,396
Income attributable to depositors 581,793 577,500 613,236 407,832 426,135
Profit before tax and zakat 170,536 230,548 241,188 140,313 174,768
Profit after tax and zakat 149,907 181,625 179,494 98,806 172,857
Key Statements of Financial Position (RM’000)
Total Assets 23,526,342 23,943,691 22,885,610 22,828,813 25,767,869
Financial Investments 6,471,174 6,624,563 5,700,141 5,016,779 4,217,846
Total Financing of Customers 14,918,272 14,687,846 15,330,895 15,861,238 18,115,817
of which: Gross Impaired Financing 351,920 285,416 221,216 209,166 194,711
Total Deposits from Customers 19,917,482 20,172,527 19,144,118 18,940,552 21,501,366
of which: CASA 4,225,851 5,006,151 5,343,192 5,895,877 7,756,200
Shareholders Equity 2,138,571 2,299,916 2,351,419 2,468,815 2,650,652
of which: Share Capital 1,195,000 1,195,000 1,195,000 1,195,000 1,195,000
Financial Ratios (%)
Return on Equity - Before Tax and Zakat 8.25% 10.39% 10.37% 7.76% 6.83%
Return on Equity - After Tax and Zakat 7.25% 8.18% 7.72% 5.47% 6.75%
Return on Assets - Before Tax and Zakat 0.74% 0.97% 1.03% 0.82% 0.72%
Return on Asset - After Tax and Zakat 0.65% 0.77% 0.77% 0.58% 0.71%
Cost Income Ratio 55.3% 61.4% 56.5% 59.8% 54.7%
Capital Ratio 16.7% 18.4% 18.6% 18.7% 18.0%
Gross Impaired Financing Ratio 2.31% 1.92% 1.43% 1.31% 1.07%
CASA Composition to Total Deposits 21.2% 24.8% 27.9% 31.1% 36.1%
Note:
1. FY16/17 refers to financial year from April 2016 to March 2017
2. FY17/18 refers to financial year from April 2017 to March 2018
3. FY18/19 refers to financial year from April 2018 to March 2019
4. FY2019 refers to financial period from April 2019 to December 2019
5. FY2020 refers to financial year from January 2020 to December 2020